About Us
Dashboards or Snapshots
According to much research, about 65% of the general population are visual learners, and providing visuals along with data improves both comprehension and retention. So, adding a dashboard or snapshot summary as the cover page for the more detailed financial report packet, featuring charts and graphs showing trends and comparatives, is likely to enhance understanding among your board members and other key stakeholders of your organization’s financial data.
What’s Most Important?
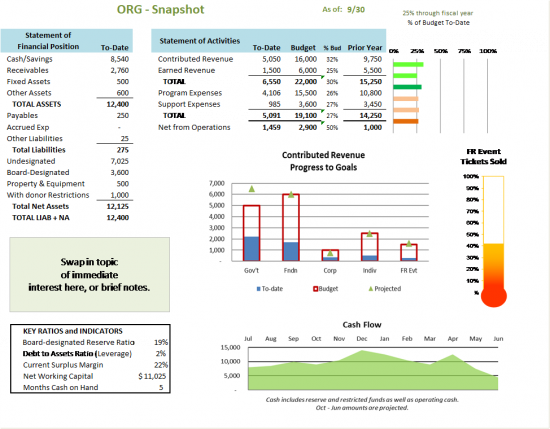
Creating a high-level, one-page summary enhanced by visuals will go a long way toward communicating what you most want the board to know about your organization’s finances. To be most effective, you’ll need to decide what key data and indicators to include in a dashboard. For small and midsize organizations this may include a highly summarized version of the Statement of Financial Position (SOFP) and the Statement of Activities (SOA) along with the organization’s cash position and such performance-to-goal indicators as for income or attendance targets, cash flow projections, or other indicators that affect the financial wellbeing of the organization.
How to Present the Data
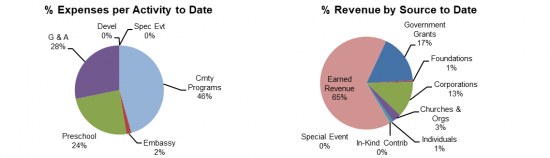
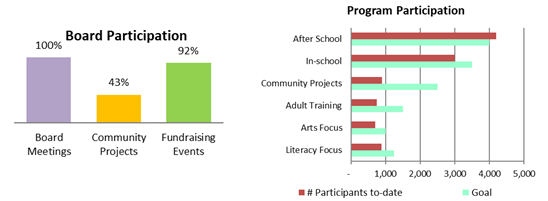
Some data, such as the SOFP and SOA, may best be shown in highly summarized numbers. Vertical or horizonal bar charts, including thermometers, can show % of budget to-date, progress to goals, and trends. Area charts can show cash flow actuals and projections. Pie charts, while not useful for trend or comparisons, can be used to show revenue concentrations by source or portions of expenses by activity. Other, non-financial indicators can also be added to track important goals set by the board such as board participation or program participation.
A variety of samples are shown below.
Which indicators are included can change from month-to-month or quarter-to-quarter, depending on what is of immediate importance or interest to the board and what goals they have set that they want to monitor. A set of trend graphs could be shared annually at year-end, perhaps to track net assets, net income, etc. Adding trends and comparatives provides more context for consideration.
A staff person or volunteer who is reasonably capable in Excel can create the visuals using your financial and performance data. There are so many possibilities. Ask your board or finance committee what they want to see.
Return to the Internal Reports Introduction page for links to greater detail on how to read various reports as well as reccomended formatting.